


*as represented by a squiggly line and some guesswork. Terms and conditions may apply. Please read this blog responsibly. Or not.
Fellow ruggers website Rugby4Cast took a look at the pre-World Cup form guide earlier in the month, by analysing the win rates of the Rugby World Cup winning teams in the years leading up to those wins. Then they looked at the same metric for the top rugby nations across the last 3 years to see if that helps to figure out who will win the 2019 Rugby World Cup in Japan.
Scotland’s graph looked about as reasonable as you’d expect (vaguely upwards after 2015), to which your correspondent scoffed and said – yeah but what about the noughties? Could we learn anything about the current team by looking at the past?
Armed with some figures from ESPN Scrum and a spreadsheet, here is our own graph of the Scotland rugby team win rate throughout the Rugby World Cup era, since 1987. It encompasses some of our glory years (1990, 1999), the advent of professionalism (and Nelson Mandela) in 1995 and plenty of dross before the current purple patch.
Just as well winning isn’t everything, eh?
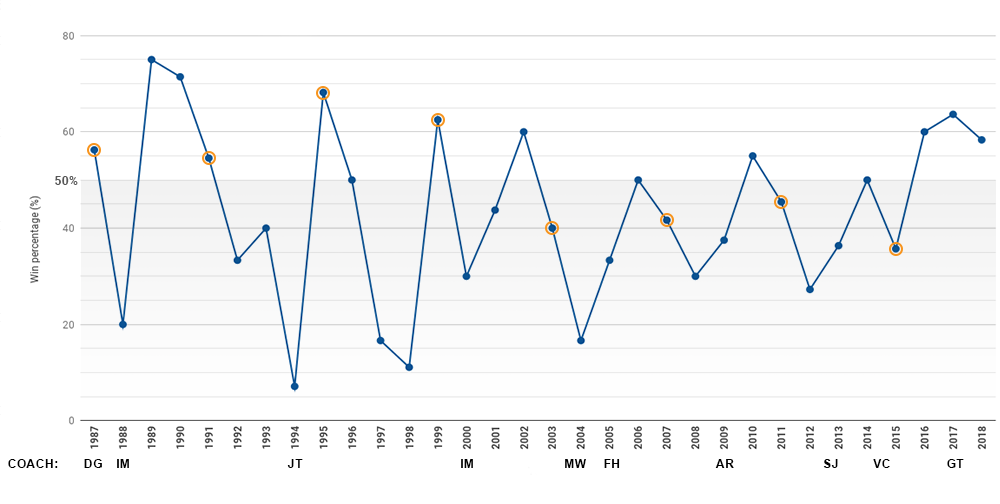
You can click to see a larger version (opens in new tab). Orange markers indicate Rugby World Cup years and coaches initials are in the year they took charge.This link should get you to the data with the query pre-defined if you want a closer look.
What is initially the most striking is how wildly inconsistent Scotland were at the dawn of the professional era, going from years where they won a lot, to hardly at all. 1994 was the nadir, with a Win/Loss/Draw record of 0/6/1 (7%= 1/2 a win). Yet the next year was one of the best.
The biggest change has been an improvement in those differences as the cone of peaks and troughs narrows towards the present day. Scotland gradually became more consistent year to year, but it’s worth noting that cone was narrowing to a point around 40-45%. Had it settled there, Scotland would be competitive but regularly lose more than they won.
To change that trend, Scotland needed to build an assembly line of winners.
A closer look at the top 10
Of the 32 years covered, there are only 11 years where Scotland have won more than they have lost and so the top 10 really are about the best years we’ve seen in this period – the others were all “losing” or “drawing” years, bar 1991.
| Year | Games | W | L | D | % | F | A | PD | Tr |
|---|---|---|---|---|---|---|---|---|---|
| 1989 | 6 | 4 | 1 | 1 | 75.00 | 145 | 76 | +69 | 20 |
| 1990 | 7 | 5 | 2 | 0 | 71.42 | 143 | 81 | +62 | 20 |
| 1995 | 11 | 7 | 3 | 1 | 68.18 | 352 | 183 | +169 | 34 |
| 1999 | 12 | 8 | 4 | 0 | 66.66 | 405 | 249 | +156 | 50 |
| 2017 | 11 | 7 | 4 | 0 | 63.63 | 316 | 261 | +55 | 41 |
| 2002 | 10 | 6 | 4 | 0 | 60.00 | 273 | 215 | +58 | 31 |
| 2016 | 10 | 6 | 4 | 0 | 60.00 | 253 | 199 | +54 | 23 |
| 2018 | 12 | 7 | 5 | 0 | 58.33 | 320 | 256 | +64 | 40 |
| 1987 | 8 | 4 | 3 | 1 | 56.25 | 209 | 175 | +34 | 29 |
| 2010 | 10 | 5 | 4 | 1 | 55.00 | 163 | 207 | -44 | 5 |
The Grand Slam in 1990 should perhaps not have been too surprising, given their high win rate the previous year (topping the table) too, but the number of games played in an international season has risen since those days which makes it relatively harder to achieve now (unless you are New Zealand). Those still remain our highest peaks in this era (the win rate in Grand Slam year 1984 was 66.66% from 6 games, if you are interested).
There are three out of the first four World Cup years present in the 10 best years, which suggests that playing extra fixtures against Tier 2 sides in a year perhaps boosted the score a bit, but as the general standard of world rugby (and World Cups) has improved over time this has had less effect.
To fans, 1999 feels like some sort of stylistic peak at the try-scoring Five Nations Championship-winning side (who also made the quarters of the World Cup) but there was an extra pre-quarters knockout round against Samoa in those days.
In 1995, the year the game turned professional, Scotland actually won more games and came much closer to a World Cup semi. In 1991 Scotland finished a record 4th in the World Cup but the year overall is no great shakes based on looking just at win-rate.
What might surprise is the absence here of 2015 which was by far our best effort at a recent World Cup – but which was counteracted by an awful 6 Nations; Scotland went into that World Cup with only 2 warm-up wins over Italy to their name, out of 9 matches…
This perhaps goes to show that purely looking at win-rate isn’t going to reflect World Cup performance, especially with other factors like the peculiar psychology of the 6 Nations or a new coaching regime also having an effect.
New Coach Bounce
Hot take: Vern Cotter is the only coach not to have had a positive upward impact in the year he took over.
Matt Williams technically took over in December 2003 but presided over no games until 2004. However Cotter’s influence looks like it could be ultimately more valuable, as that 2015 Rugby World Cup was a turning point: if you drew a sort of cone along the high and low points on the graph, the clearest conclusion is that as of about 2016, Scottish rugby started bucking the trend of “more consistent, but heading for a 50/50 ratio” and entered new territory.
Most encouraging is the presence of the last three years in this top ten. This represents the first time since that 1990s heyday where Scotland have kept a win rate above 50% for 3 years running. A fourth year with a win rate above 50% for 2019 would make them the most consistently successful Scottish team of the modern era, silverware notwithstanding.
Maybe the current group of players really could be as good as the 1990 side or Toony’s 1999 generation?
Forward to 2019
Another consideration is the success of other teams relative to us: France haven’t managed to get above 40% in the last three years so this could be a chance to pick up a couple of wins against them. On the other hand Ireland had win rates of 54.1, 81.8 and 91.66% which means Scotland would be heavy underdogs even at home.
The All Blacks haven’t dropped below 82% since 2009. That’s what a great team looks like, so it is clear Scotland are currently a good team but not much more yet.
Even without a World Cup quarter-final spot – still a hefty assumption – to achieve a winning record in 2019 Scotland would need to win 7 or more of the 13 games we know about, and only 5 are at BT Murrayfield:
Ita, Ire, Fra, Wal, Eng | Geo, Fra, Fra, Geo | Ire, Sam, Rus, Jap
That’s a big ask purely in terms of game time and the physical toll it will take on our front-line players, but one for which the current crop of players should be ready. A word of warning before you make your lists of which ones we’re off to win: the only two years Scotland have played more than 12 tests were 2003 and 2015 and both years saw success rates of under 40%.
The question is, now we are going in the right direction, can Scotland’s upward trend continue in this World Cup year and beyond?